Scale
The Un-SaaS Ch. 3 — The Vision
What a typical Tuesday looks like for an operator with twelve positions, seven partners, and four niches — including the honest numbers.
July 10, 2026 · 13 min read

Chapter 3 of 26
This is a chapter from The Un-SaaS: A Toll Stack Engineer's Handbook. Each Friday, we're publishing a chapter as a bonus for our readers.
There’s a scene in The Shawshank Redemption where Red narrates Andy Dufresne’s daily life inside the prison. From the outside, nothing is happening. Andy goes to work in the library. Andy writes letters to the state legislature. Andy does his banking thing for the warden. The same Tuesday, every week, for nineteen years.
But under the surface, Andy is tunneling.
Every night, a handful of rock dust goes into his pocket. Every morning, a handful gets scattered in the yard. No single day produces a visible result. No single week produces a measurable change. The tunnel is invisible to anyone who isn’t digging it.
Then one Thursday night, he crawls through the wall and comes out the other side.
I think about that scene a lot when I think about what year three of the Toll Stack looks like — because it doesn’t arrive as a sudden transformation. It arrives as a Tuesday that feels unremarkable until you stop and look at what’s actually running.
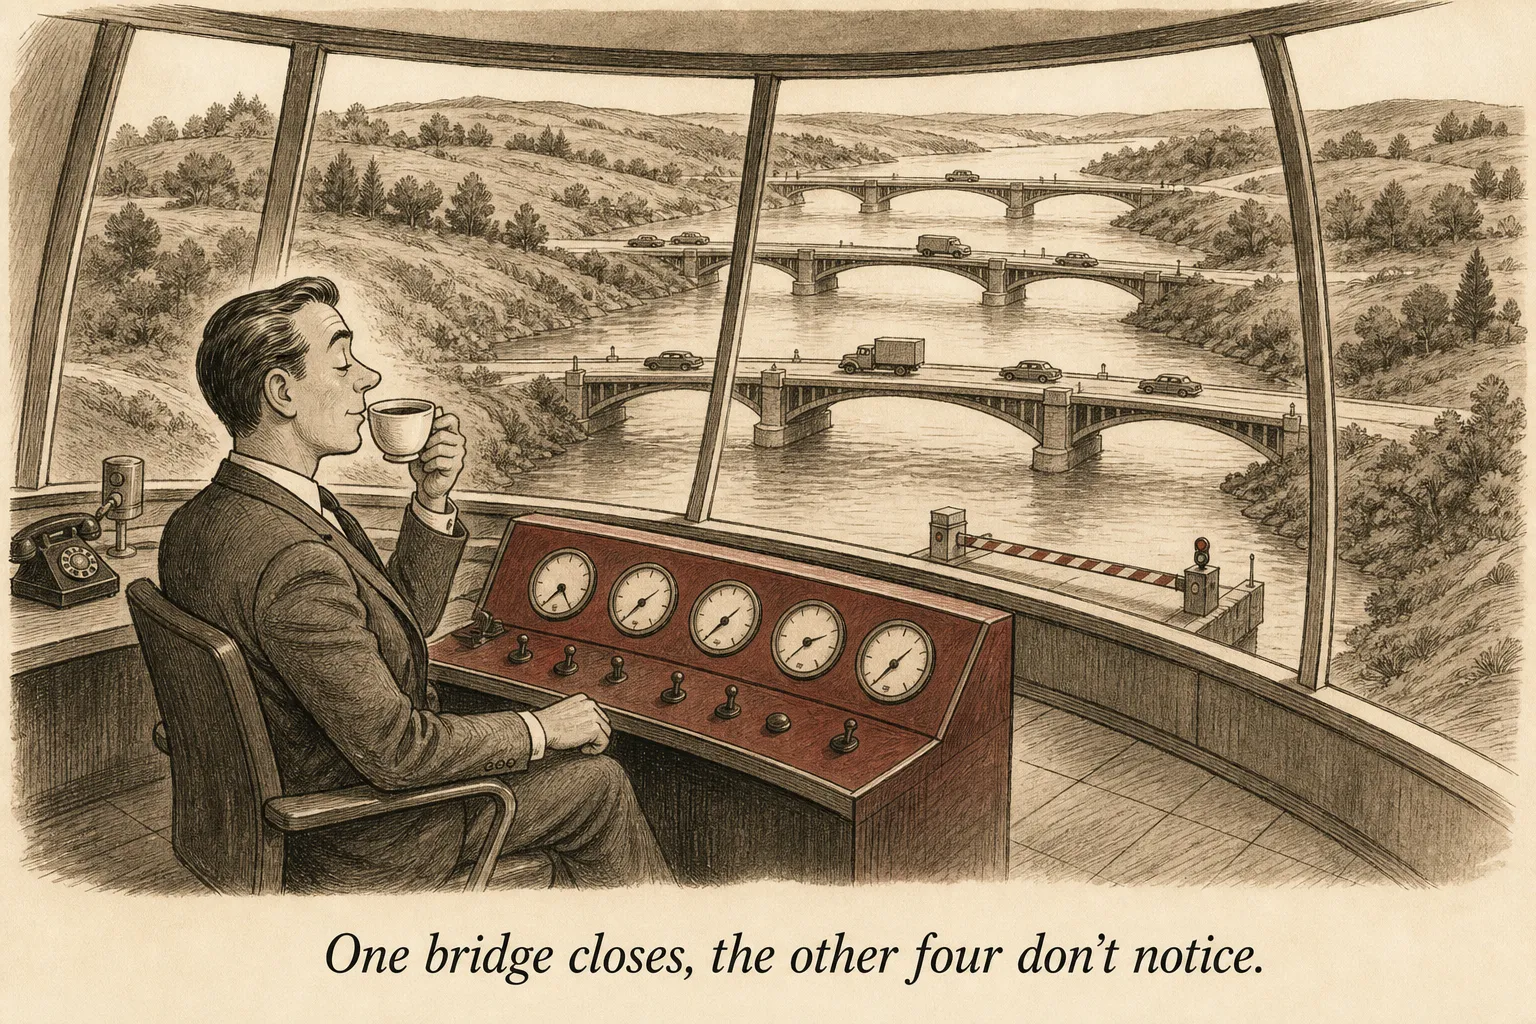
A Typical Tuesday
It’s 6:45 AM. Your phone buzzes with a Slack notification from one of your AI agents. It’s the daily digest — a five-line summary of what happened across your portfolio overnight.
Three experiments completed. One winner: a subject-line variant on position #4 that lifted open rates by 8%. The agent has already promoted the winner and queued the next test. Two losers: a headline swap on position #9 and a send-time shift on position #2. Both reverted automatically. No action required.
Revenue overnight: $412 across six positions. Two positions didn’t generate revenue overnight — one is in a niche where the audience doesn’t buy at 2 AM, the other is in a seasonal dip.
List growth: 127 new subscribers across four active capture pages. One subscriber flagged as a high-value pattern — they entered through position #6 (a fitness creator’s traffic) and immediately clicked on a cross-promoted offer from position #11 (a nutrition brand). That cross-network signal goes into the intelligence database automatically.
You scan the digest. Nothing needs your attention. You close Slack and make breakfast.
At 8:55 AM, you log into your day job. Nobody there knows any of this exists.
At 6:30 PM, after the kids are in bed, you sit down for ninety minutes. Tonight’s agenda:
- Review the weekly metrics dashboard. Twelve cards, one per position. Ten are green. One is yellow — a partner in the personal finance niche has been posting less frequently. Traffic to your landing page is down. You note it but don’t panic. Portfolio construction means this one position is 9% of your monthly revenue, not 100%.
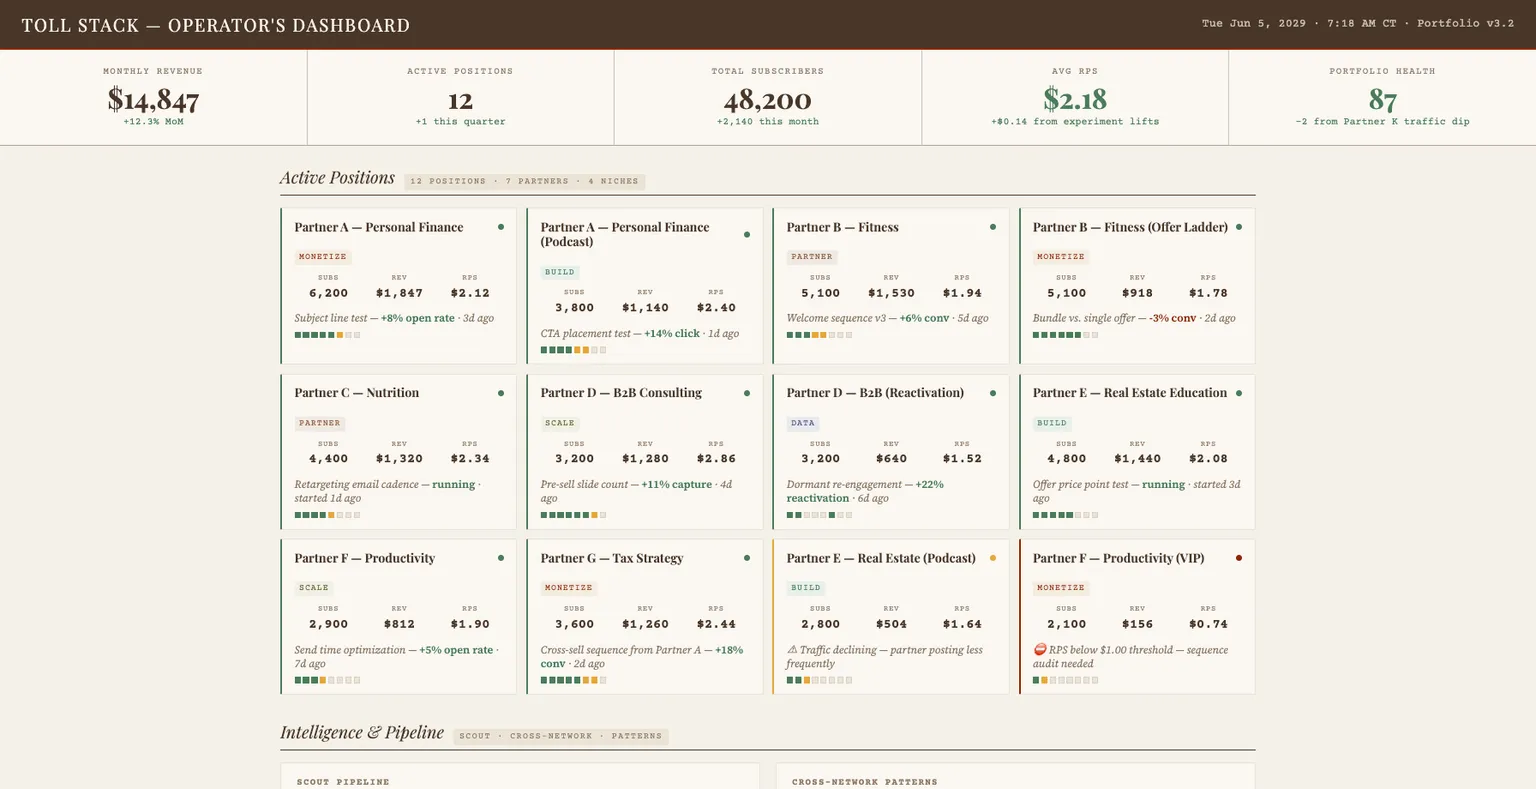
- Read the partner pitch that’s been sitting in your drafts for three days. A podcast host in the B2B consulting space with 15,000 downloads per episode and no lead capture whatsoever. Dead clicks everywhere. Your pitch is ready. You hit send.
- Spend forty minutes building a landing page for a potential new partner — a course creator in the real estate education niche who said yes last week. The AI agent does the initial build from your template library. You customize the headline, review the five-slide sequence, and schedule the A/B test.
At 8:00 PM, you close the laptop. Total active time today: ninety minutes, plus the six minutes reading the morning digest.
That’s Tuesday. Wednesday looks the same. Thursday too. It’s not dramatic. It’s not inspiring. It’s just infrastructure, running.
The Portfolio at Year Three
Let me be specific about what the Tuesday above implies. Here’s a composite view of what a Toll Stack portfolio looks like after three years of part-time assembly:
Twelve positions. Seven partners. Four niches.
- Niche 1 (Personal Finance): Two partners. Three positions — a landing page + email sequence for a YouTube creator (400K subscribers), a lead magnet funnel for a podcast (25K downloads/episode), and an offer-ladder upsell wired into the podcaster’s existing $47 ebook.
- Niche 2 (Fitness/Health): Two partners. Three positions — a full-stack flagship for a fitness creator (landing page + email + offer bump + reactivation), and two simpler capture-and-convert positions for smaller creators in adjacent sub-niches.
- Niche 3 (B2B Consulting): Two partners. Four positions — two landing page + email setups, one pre-sell launch system that runs twice a year, and one reactivation campaign hitting a 40,000-person dormant list quarterly.
- Niche 4 (Education/Courses): One partner. Two positions — a landing page and a welcome-to-buyers sequence that converts course purchasers into repeat buyers.
Revenue composition:
- Total monthly gross: $12,000 to $16,000 (after all splits, before your infrastructure costs)
- Infrastructure cost: $180/month
- Net to you: $11,820 to $15,820/month
- Annualized: $142,000 to $190,000
Time investment:
- Active hours per week: 10 to 14
- Breakdown: ~2 hours on daily digests and approvals, ~4 hours on weekly optimization and experiment review, ~4 to 8 hours on new partner development and position building
Portfolio health metrics:
- No single partner represents more than 22% of monthly revenue
- No single niche represents more than 32% of monthly revenue
- Aggregate email list: 52,000 subscribers across all positions
- Experiment log: 800+ completed tests across all positions
- Cross-network intelligence database: behavioral profiles on 52,000 contacts with purchase history across 7 partners
The Honest Distribution
Now for the part most books leave out: what this doesn’t look like for everyone who tries it.
I’m going to give you three numbers, and I want you to read all three, not just the one you want to hear.
Top decile (top 10% of operators): $100,000 to $300,000 annual net. These are operators who found high-traffic partners quickly, optimized aggressively, and assembled a twelve-position portfolio within eighteen to twenty-four months. They had some combination of technical skill, good niche selection, and luck with early partner relationships. This is the ceiling for part-time solo operation. Some in this bracket eventually go full-time and push higher.
Median operator (50th percentile): $30,000 to $80,000 annual net. These operators have four to eight active positions, five or fewer partners, and one to three niches. They hit their stride around month twelve to eighteen. The portfolio produces meaningful parallel income but hasn’t yet reached the compound-growth inflection that the top decile experiences. Many median operators stay here permanently and are happy with it — $50,000 in parallel income alongside a W-2 is a fundamentally different financial position than a W-2 alone.
Bottom half (below median): $5,000 to $20,000 annual net. These operators built one to three positions, may not have found the right partner niche, or didn’t sustain the weekly optimization cadence that makes the experiment log compound. Some stalled after the first partner and never added a second. Some picked partners with low traffic and thin margins. Some simply didn’t put in the twelve to eighteen months of consistent work that the model requires before the curve bends.
The bottom half is not zero. Even a single well-built toll position produces something — a few hundred to a few thousand dollars a month. But the difference between $5,000 a year and $150,000 a year is the difference between a hobby and a financial engine.
What separates the top from the bottom isn’t talent. It’s three things:
Partner selection. The operators who do well pick partners with real traffic — thousands of views per video, thousands of downloads per episode, thousands of visitors per month. The operators who struggle pick partners with small audiences and hope the toll position will somehow generate traffic. It won’t. The operator doesn’t generate demand. The operator monetizes existing demand. No demand, no toll.
Consistency. The experiment log compounds. But only if you run experiments. The operators who treat the weekly optimization session as non-negotiable — like a production on-call rotation that you just do, whether you feel like it or not — are the ones who win. Their positions improve by 2% to 5% per month. Compounded over twelve months, that’s a 27% to 80% total improvement from the original deployment. The operators who build the position and then stop optimizing are the ones whose revenue stays flat.
Portfolio construction. One position is a bet. Five is a portfolio. Twelve is an engine. The operators who add the second partner within sixty days — while the first position is still finding its legs — are the ones who hit the cross-network intelligence threshold faster. They start seeing the compound effects that make the model really work. The operators who wait for the first position to be “perfect” before adding a second one often never add the second one.
What Year One Actually Feels Like
I won’t lie to you about this. Year one feels dark.
Months one through three are pure construction. You’re building infrastructure, pitching partners, learning the tools, and producing zero or near-zero revenue. The experiment log is empty. The list is tiny. The revenue line is embarrassingly close to flat.
Months four through six produce the first real revenue, but it’s modest. A few hundred dollars a month. Maybe a thousand if you found a good first partner. You’re doing the math — “I put in sixteen hours on the initial build, and I’ve spent maybe four hours a week since. My hourly rate is… bad.” This is the moment most people quit.
Months seven through twelve are where the curve starts to bend. The list is compounding. The experiment log has enough data to produce real lifts. The second or third partner is starting to generate captures. Monthly revenue crosses $1,000, then $2,000, then $3,000. Not a hockey stick — more like a ski slope that took nine months to realize it was going uphill.
The year-one total is typically $8,000 to $25,000 for an operator who sustains the cadence. Not life-changing money. But the infrastructure is in place, the data moat is deepening, and the compound curve is inflecting.
Year two is where it starts to look like the Tuesday I described. Year three is where it starts to look like the portfolio at the top of this chapter.
The operators who make it to year three almost never quit. By that point, the thing runs. The positions produce. The agents handle the daily churn. The experiment log is deep enough that each new position starts near-optimized instead of starting from scratch.
The ones who quit almost always quit in months four through six — the valley between construction and compounding, where the effort is high and the evidence is thin.
If you can get through that valley, the other side is exactly what the Saturday-morning dashboard in the manifesto looks like.
The Tuesday Test
I want to leave you with a filter you can apply to everything in this book.
Before you read a chapter, before you consider a tactic, before you evaluate a framework — ask yourself: Does this make my Tuesday better?
Not more dramatic. Not more exciting. Not more impressive on LinkedIn. Better. Calmer. More productive per hour spent. More revenue per position. More confidence that the infrastructure is running while you’re not watching.
The Toll Stack is a Tuesday business. It’s not a launch business, or a hustle business, or a grind business. It’s a “close the laptop at 8 PM and know the thing is still running” business. Every chapter in this book is in service of that Tuesday.
The next three chapters explain why this isn’t new, how the mental model actually works, and what it means to be an Un-SaaS. That’s a Toll Stack Engineer who uses everything they learned building software products, without building another product.
Beyond the Screen

Everything in this book so far has lived on the internet. YouTube descriptions, email sequences, landing pages, Stripe Connect integrations. Digital traffic, digital infrastructure, digital tolls.
But the toll position model doesn’t require a screen. It requires three things: a captive audience, commercial activity nearby, and zero commerce infrastructure connecting the two. Wherever those three conditions exist — online or off — the operator has a position to build.
Let me show you the clearest example I know.
A vacation rental on the North Shore of Kauai books for $400 a night. Two laminated sheets sit on the refrigerator door. One has the house rules. The other has the wifi password and checkout time. That is the entire guest communication infrastructure for a property whose guests will spend $3,000 on the island during their stay.
Do the math. The property books roughly forty weeks a year at an average of two to three guests per booking. Average visitor spending on Kauai: $213 per person per day. For a seven-day stay with two adults, that’s roughly $3,000 in on-island spending — tours, dining, car rentals, activities, shopping.
Forty bookings times $3,000 in average on-island spend equals $120,000 per year in guest activity spending flowing past this refrigerator. The property manager captures exactly zero of it. The guests spend that money somewhere — they book the boat tour, they eat the expensive dinner, they rent the snorkel gear — but nobody sits between the fridge and the spending.
Now scale it. A property manager with fifteen units runs roughly $1.8 million in annual guest activity spending through their portfolio. A manager with fifty units sits on top of $6 million. And their guest communication infrastructure is two laminated sheets and a wifi password.
The operator builds three things. First, a guest experience page — a property-specific landing page with curated local recommendations, activity bookings, restaurant guides, and transportation options. The page URL goes on a card by the fridge, in the welcome email, and on the wifi captive portal.
Second, a timed email sequence — five emails mapped to the booking lifecycle: confirmation day, two weeks before arrival, three days before arrival, check-in day, and checkout day. Each email surfaces context-aware recommendations with booking links routed through your commerce layer. Third, an AI chatbot concierge that lives on the guest experience page. “We have three kids under eight and it’s raining tomorrow. What should we do?” The chatbot recommends the museum, the indoor adventure park, and a cooking class. Each recommendation is genuinely useful and commercially productive.
The economics work at portfolio scale. A single property at 8% affiliate commission produces maybe $1,440 a year — not enough to matter. But at fifty properties with direct deals negotiated at 15% to 18% commission, the same model produces north of $200,000 a year. The marginal cost of adding a property is close to zero. The chatbot, the email sequences, the affiliate relationships — all built once. Each new property is a few hours of onboarding.
And the property manager says yes for the same reason the YouTube creator says yes: the deal is low-risk. You build the infrastructure on your dime. They change nothing about their operations. If it works, they get a revenue share plus — and this is the real Trojan horse — a chatbot that handles 80% of the midnight texts about garbage disposals and checkout times. You’re not selling revenue architecture. You’re selling fewer midnight texts. The revenue is the bonus.
Here’s what matters for the vision chapter: the vacation rental is not a special case. It’s a pattern.
Marinas. Two hundred slips. Boaters who need fuel, maintenance, fishing charters, dockside dining, marine supplies. Average annual spending: $5,000 to $12,000 per slip holder. A marina member portal with a chatbot captures commission on every referral. The marina operator’s current commerce infrastructure: a bulletin board in the ship store.
Wedding venues. Forty weddings a year. Each couple needs florists, photographers, caterers, DJs, rental companies, hotel blocks, transportation. Average wedding cost: $35,000. The venue captures its rental fee. The other $20,000-plus flows to vendors the couple found on Google. A curated vendor marketplace with referral fees: $2,000 per event, $80,000 a year.
Coworking spaces. Members who need accountants, lawyers, IT support, printing services, catering. A member chatbot recommending vetted service providers generates referral revenue on professional services with high lifetime values.
Campgrounds. Corporate housing. Airport hotels. Ski lodges. Conference centers. Every one of them has the same three conditions: a captive audience spending money on commercial activity nearby, with zero commerce infrastructure connecting the two.
The pattern is the same one William Edwards saw at the Taff River in 1757. People standing on one bank, needing to get to the other, with no bridge in sight. The only difference is that the river is a refrigerator door and the bridge is a chatbot. The toll works the same way it always has.
When you look at the Tuesday I described at the top of this chapter — twelve positions, seven partners, four niches — some of those positions don’t have to be digital. Some of them can be a guest experience page on a refrigerator in Kauai, producing revenue while tourists book boat tours and you close the laptop at 8 PM.
That’s the full vision. Not just an internet business. An infrastructure business. Built wherever demand flows and nobody’s built the bridge.
Next Friday: The toll position model has worked for seventy years. Same architecture, different tools. Here is the pattern.
Scale
Ready to go from one position to a portfolio?
This article explored scaling. The newsletter delivers portfolio expansion patterns and operational frameworks weekly.
Unsubscribe in one click. Useful operator material only. Promotions, sponsors, and partner links will be disclosed.